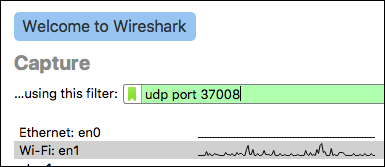
On Wireshark's initial screen, select the interface where the packets from
the Mikrotik will be arriving, and enter "udp port 37008" as the capture
filter.
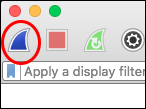
Click the Start button (the first button on the toolbar, looks like a blue shark fin)
John Simpson <jms1@jms1.net> 2016-05-16, last updated 2018-01-10
RouterOS has a built-in packet sniffer. The packets that it captures can be stored to a file on its local filesystem, or they can be sent to another machine in real time. Wireshark can receive this stream of packets and show, filter, or save them, just as if it had captured the packets from a local interface on its own. This allows you to see exactly what packets are entering or leaving an interface on the Mikrotik.
The packets are sent from the Mikrotik to your local machine using a protocol called TZSP. There doesn't seem to be a whole lot of documentation out there about the protocol itself, the best I could find are:
An archived copy of the original protocol definition
Wireshark's documentation about the decoder
However, the protocol is fairly simple - each TZSP packet consists of a
small header followed by the "payload", i.e. the captured packet which is
being forwarded. The fields within the header are documented on the links
above. The machine receiving the TZSP packets listens on port 0x9090/udp
(which is 37008 decimal.)
The Mikrotik must be able to send traffic to port 37008/udp on the
machine where you are running Wireshark.
If your workstation is connected to the Mikrotik's "internal" network, or is connected to the Mikrotik using a VPN, then it should just work. If not, you may need to set up some kind of firewall or "port forwarding" rules in order to allow this traffic.
The captured packets will be sent from the MikroTik to your laptop using the
TZSP protocol, which uses port 37008/udp. The same port is also used by
a protocol called "WCCP". If Wireshark mis-categorizes the incoming traffic,
you may need to disable the WCCP protocol decoder.
To capture TZSP traffic:
On Wireshark's initial screen, select the interface where the packets from
the Mikrotik will be arriving, and enter "udp port 37008" as the capture
filter.
Click the Start button (the first button on the toolbar, looks like a blue shark fin)
Everything is done under /tool sniffer on the Mikrotik.
[jms1@ENGfw] /tool sniffer> print
                     only-headers: no
                     memory-limit: 1024KiB
                    memory-scroll: yes
                        file-name:
                       file-limit: 1000KiB
                streaming-enabled: yes
                 streaming-server: 172.31.16.200
                    filter-stream: yes
                 filter-interface: external
               filter-mac-address:
              filter-mac-protocol:
                filter-ip-address: 10.40.0.189/32
               filter-ip-protocol: tcp
                      filter-port: 8142
                       filter-cpu:
                 filter-direction: any
  filter-operator-between-entries: or
                          running: no
For this example, I was capturing traffic to/from 10.40.0.189 port
8142/tcp, and forwarding copies of that traffic to 172.31.16.200, where
I was running Wireshark at the time. (At the time I did this, the Mikrotik's
external interface was connected to a network with 10.40.0.0/24 on it.)
Use the "set" command to set whatever entries need to be changed.
If you need to "unset" one of the parameters, set it to "" (i.e. you
should run set filter-port="" if you're capturing ICMP).
Settings:
streaming-enabled - Tell the Mikrotik to send the captured packets
to an IP address, using the TZSP protocol. (This setting exists because the
Mikrotik could save the captured packets to a file on its local
filesystem, instead of or in addition to sending them to Wireshark.)
streaming-server - Where to send the captured traffic. Set this to
the IP of your workstation.
filter-stream: yes - tell the Mikrotik to exclude the TZSP packets
involved in sending the packets to your laptop. ALWAYS DO THIS!
filter-interface - specify the interface containing the traffic you
want to capture.
filter-ip-address, filter-ip-protocol, filter-port - specify the
traffic you're interested in.
set filter-port=""Once the capture parameters are configured, the following commands will start and/or stop the actual capture:
[admin@Mikrotik] > /tool sniffer start[admin@Mikrotik] > /tool sniffer stop